

漏斗圖
使用漏斗圖顯示步驟流程。
漏斗圖視覺化度量如何在步驟系列中細分。它們通常用於顯示有多少人完成特定順序,例如網站上的結帳流程。第一個步驟(或關卡)將是有多少人造訪您的網站。然後有多少人檢視產品頁面(步驟 2)、有多少人將該項目新增至購物車(步驟 3),依此類推。
我們將逐步說明如何在 Metabase 中使用安裝隨附的範例資料庫建立漏斗圖,以便您可以跟著操作。我們將在查詢產生器和 sql 編輯器中展示範例
範例資料庫不包含事件;它只有四個表格,其中包含訂單、產品和客戶資訊。因此,我們必須在這裡發揮一點創意,才能提出漏斗圖的範例。
使用查詢產生器的漏斗圖範例
這是一個牽強附會的範例。我們將假裝漏斗中的步驟是產品類別(因為我們的範例資料庫中沒有任何類似狀態或頁面或其他流程的東西)。以下是我們查詢的筆記本檢視
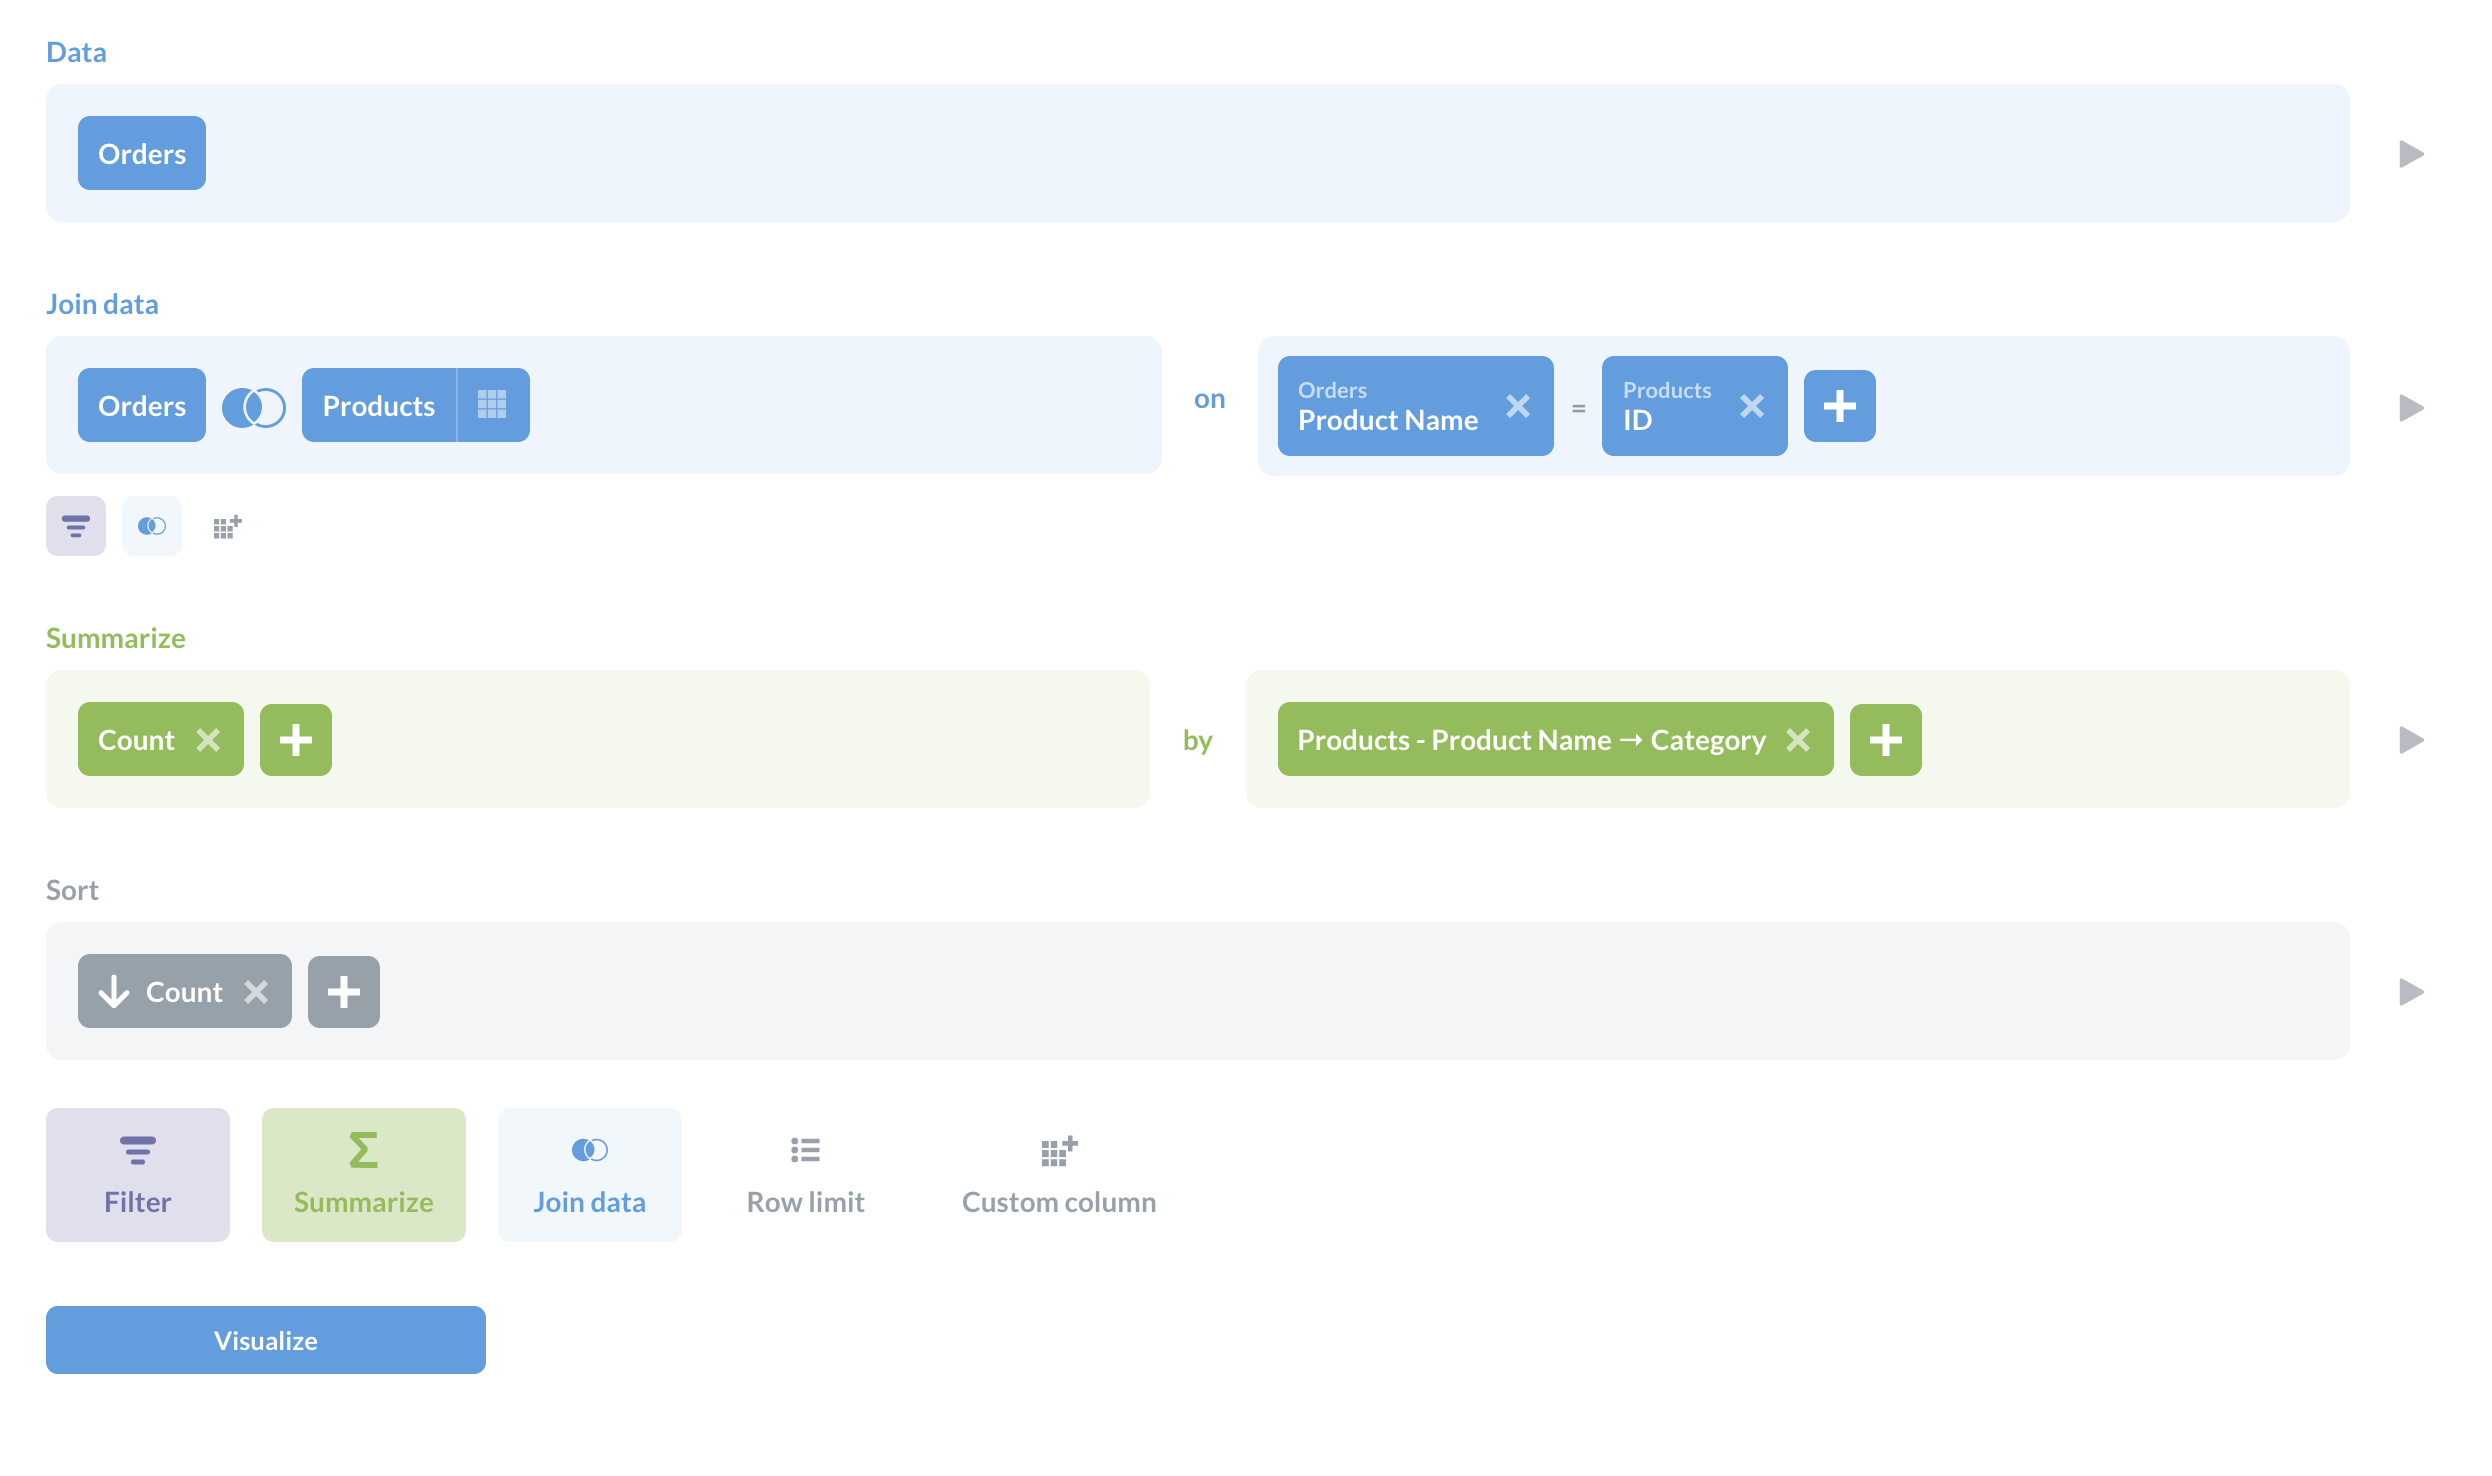
我們所做的是聯結了 Orders 和 Products 表格(請參閱Metabase 中的聯結),摘要了訂單計數,並依產品類別將這些計數分組。然後,我們依計數遞減排序結果。若要取得漏斗圖,我們按一下左下角的視覺化,並選取漏斗。在漏斗圖的設定中,在資料標籤下,您可以設定步驟(在本例中,我們使用的是產品類別)和度量(訂單計數)。
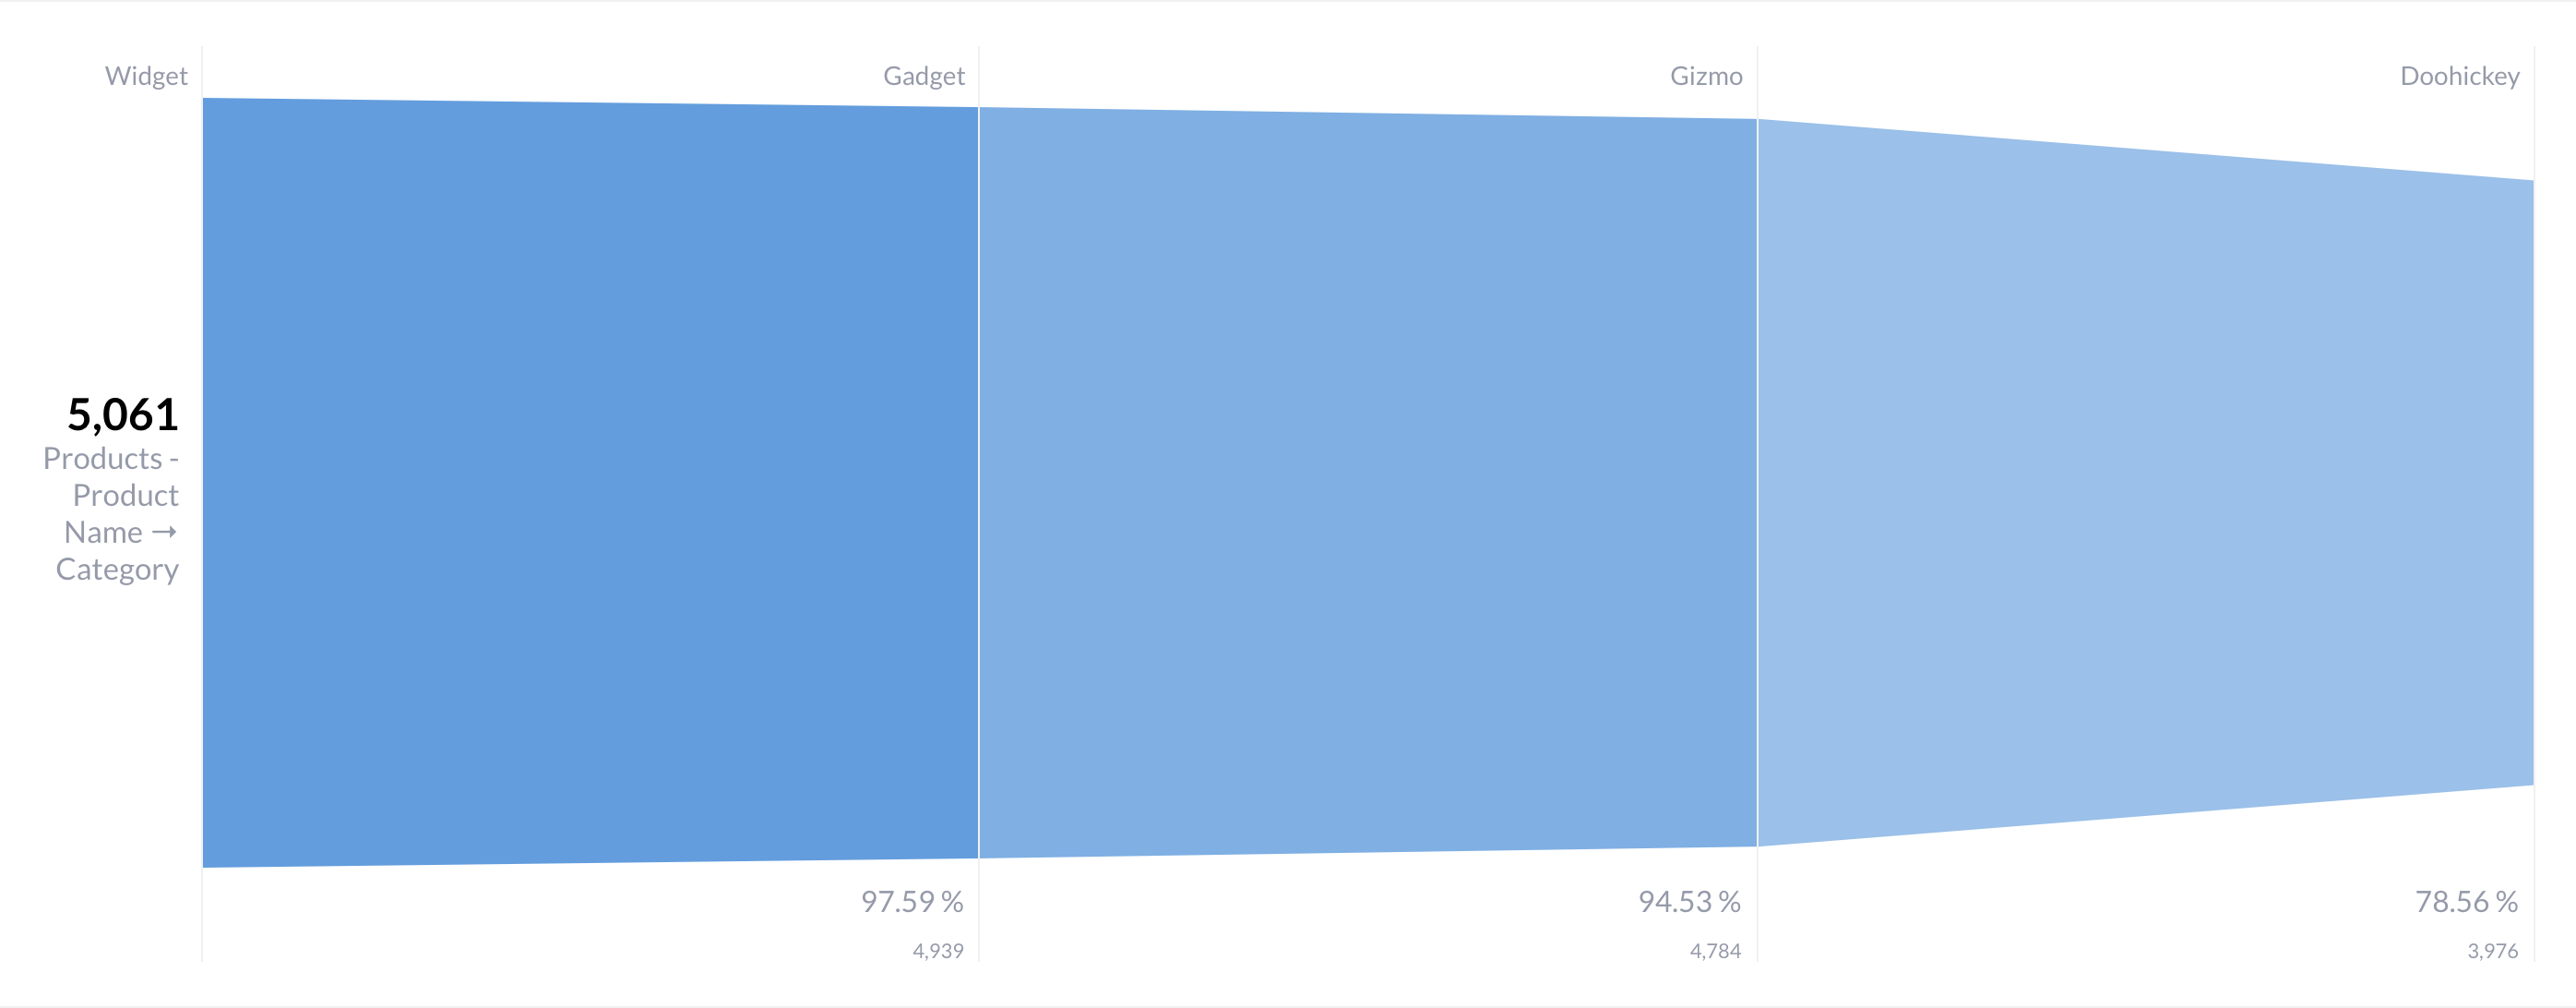
請注意,在 設定 -> 顯示 標籤中,您可以將 漏斗類型 變更為「長條圖」,這是表示資料的另一種有效方式。漏斗圖的優點(除了視覺隱喻之外)是 Metabase 也會顯示完成每個步驟的度量百分比。
使用自訂欄保持步驟排序
如果每個步驟中的計數並未自然減少,您可能需要手動排序步驟,以保留步驟的實際流程。例如,如果您在連續步驟中具有相同的計數,則步驟可能會在漏斗圖中交換,例如 Metabase 預設會依字母順序排序步驟以打破僵局。同樣地,如果您有在某些步驟中可以擴展計數的漏斗(例如,新人員在中途進入漏斗),漏斗將預設為遞減計數,這會搞亂您的步驟順序。
在這些情況下,您可以建立一個額外的欄來編號步驟,並依步驟排序以強制執行正確的漏斗順序。以以上查詢為例,我們可以修改它以透過新增另一個欄 step,然後依 step 排序來保留順序。
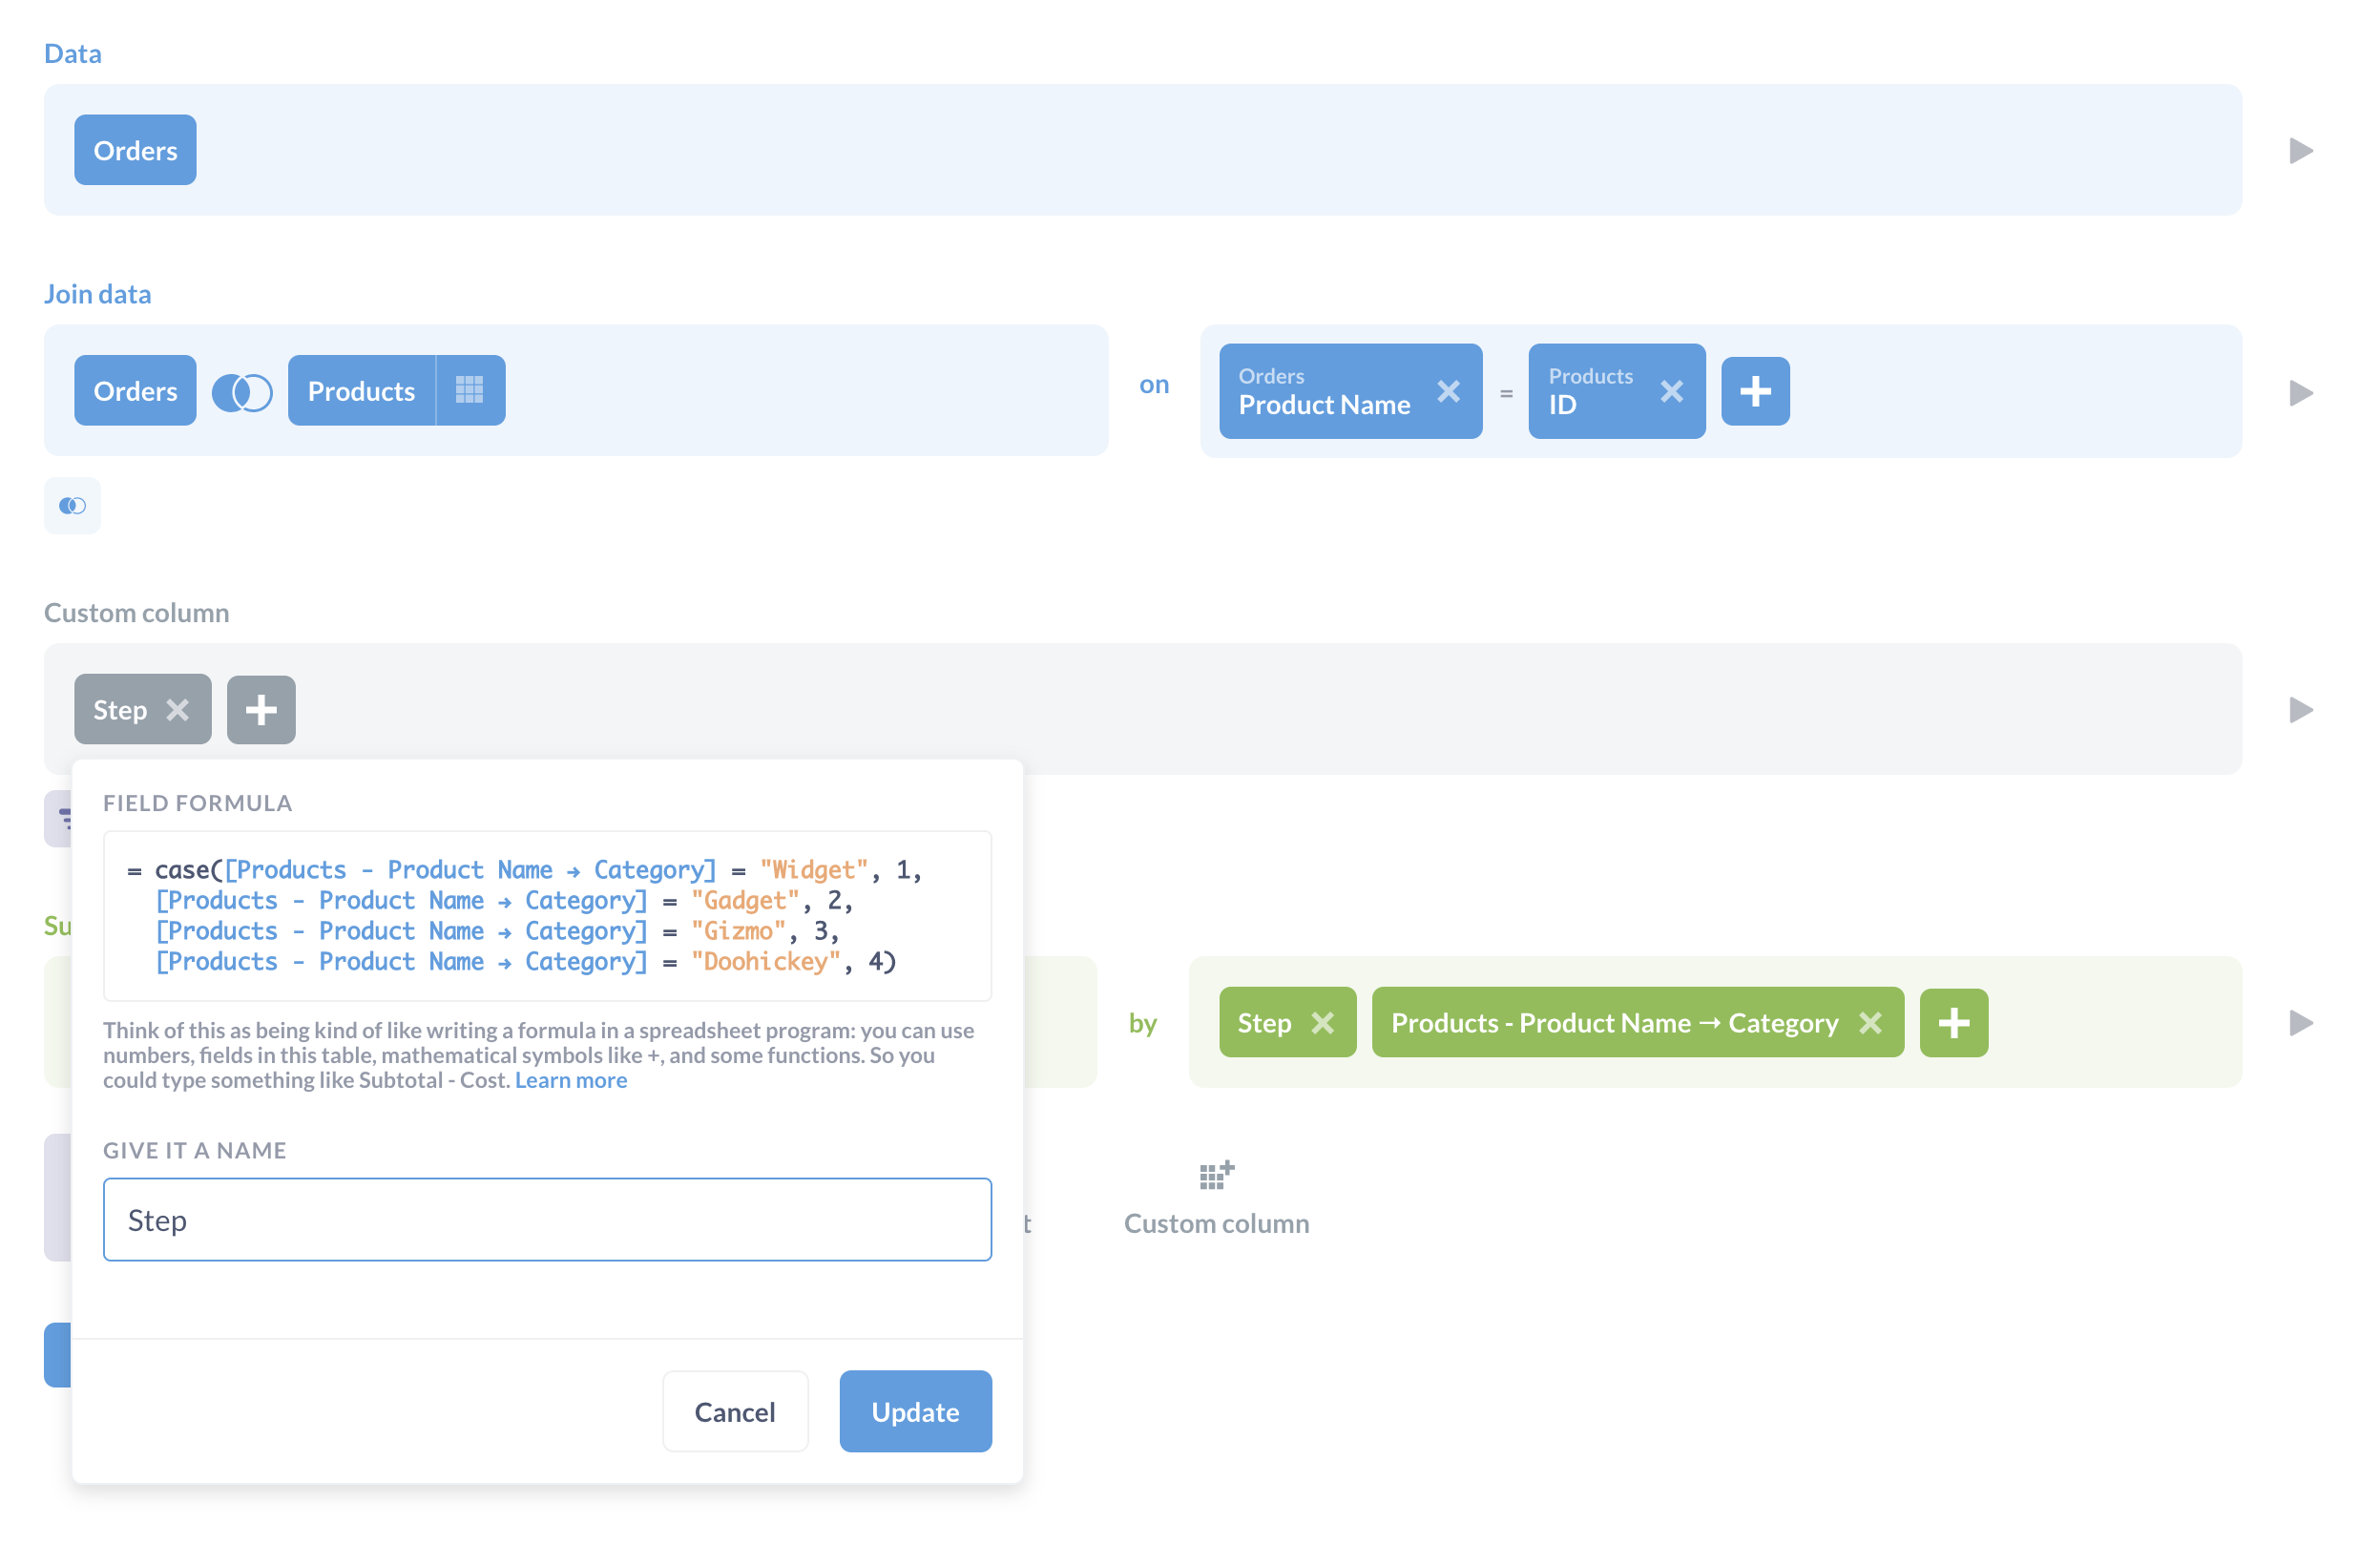
這是自訂表達式
case([Products - Product Name → Category] = "Widget", 1, [Products - Product Name → Category] = "Gadget", 2, [Products - Product Name → Category] = "Gizmo", 3, [Products - Product Name → Category] = "Doohickey", 4)
基本上,我們說 Widgets 是漏斗的步驟 1,Gadgets 是步驟 2,依此類推。
使用 SQL 的漏斗圖範例
另一個使用範例資料庫的牽強附會範例:假設我們得知終身價值最高的客戶是那些從我們所有四個產品類別(Doohickeys、Gadgets、Gizmos 和 Widgets)下訂單的客戶。因此,對於此範例,我們想要查看我們的客戶如何根據他們訂購的不同產品類別數量來細分。
這裡要做的關鍵區別是我們並非試圖查看客戶分佈,亦即,我們並非試圖查看有多少客戶僅從一個產品類別訂購,有多少客戶從兩個類別訂購,依此類推。我們將把所有針對任何類別下訂單的客戶作為步驟一。對於下一個步驟,我們將把該人口縮減為僅限於那些在至少兩個產品類別、然後三個類別、然後四個類別中下訂單的客戶。
假設我們有一個一百位下訂單的客戶群。表格看起來會像這樣
| Step: number of categories    | Count of customers |
|:------------------------------|:-------------------|
| Ordered from one category     | 100                |
| Ordered from two categories   | 70                 |
| Ordered from three categories | 40                 |
| Ordered from four categories  | 20                 |
我們的攻擊計畫:我們將使用通用表格表達式將此查詢分解為四個子查詢,每個查詢都會進一步精簡我們的結果。然後,我們將 UNION 所有結果到單一結果表格中。
我們將從取得所有向我們訂購的客戶開始,並將該查詢放入 CTE 中以建立另一個子查詢。在下面的程式碼區塊中,我們將第一個子查詢稱為 starting_data。若要取得客戶的第一個「步驟」,我們將建立一個新的子查詢 cat_one,它會將 starting_data 的結果作為其起始資料。
WITH starting_data
     AS (SELECT people.id,
                products.category
         FROM   people
                JOIN orders
                  ON people.id = orders.user_id
                JOIN products
                  ON orders.product_id = products.id
         GROUP  BY people.id,
                   products.category
         ORDER  BY people.id),
     cat_one
     AS (SELECT id,
                Count(id) AS cats
         FROM   starting_data
         GROUP  BY id
         HAVING cats > 0
         ORDER  BY id)
我們將對接下來的兩個步驟執行相同的操作(亦即,逐步建立在先前的結果之上)
WITH starting_data
     AS (SELECT people.id,
                products.category
         FROM   people
                JOIN orders
                  ON people.id = orders.user_id
                JOIN products
                  ON orders.product_id = products.id
         GROUP  BY people.id,
                   products.category
         ORDER  BY people.id),
     cat_one
     AS (SELECT id,
                Count(id) AS cats
         FROM   starting_data
         GROUP  BY id
         HAVING cats >= 0
         ORDER  BY id),
     -- People who ordered from at least two categories
     cat_two
     AS (SELECT id,
                Count(id) AS cats
         FROM   cat_one
         GROUP  BY id
         HAVING cats > 1
         ORDER  BY id),
     -- People who ordered from at least three categories
     cat_three
     AS (SELECT id,
                Count(id) AS cats
         FROM   cat_one
         GROUP  BY id
         HAVING cats > 2
         ORDER  BY id),
     -- People who ordered from at least four categories
     cat_four
     AS (SELECT id,
                Count(id) AS cats
         FROM   cat_one
         GROUP  BY id
         HAVING cats > 3
         ORDER  BY id)
因此,現在我們有了四個結果:cat_one、cat_two、cat_three、cat_four,我們需要將這些結果合併到單一結果表格中。我們將使用 UNION 來合併結果。
-- Now we union these four results to produce a single table
-- that we'll use to build our funnel chart. The table will have two columns:
-- the Step: number of categories (our step),
-- and the count of customers (our measure).
SELECT 'Ordered from one category' AS "Step: number of categories",
       Count(*)                    AS Customers
FROM   cat_one
UNION
SELECT 'Ordered from two categories' AS "Step: number of categories",
       Count(*)                      AS Customers
FROM   cat_two
UNION
SELECT 'Ordered from three categories' AS "Step: number of categories",
       Count(*)                        AS Customers
FROM   cat_three
UNION
SELECT 'Ordered from four categories' AS "Step: number of categories",
       Count(*)                       AS Customers
FROM   cat_four
ORDER  BY customers DESC
漏斗圖查詢
這是完整查詢
WITH starting_data
     AS (SELECT people.id,
                products.category
         FROM   people
                JOIN orders
                  ON people.id = orders.user_id
                JOIN products
                  ON orders.product_id = products.id
         GROUP  BY people.id,
                   products.category
         ORDER  BY people.id),
     cat_one
     AS (SELECT id,
                Count(id) AS cats
         FROM   starting_data
         GROUP  BY id
         HAVING cats >= 0
         ORDER  BY id),
     -- People who ordered from at least two categories
     cat_two
     AS (SELECT id,
                Count(id) AS cats
         FROM   cat_one
         GROUP  BY id
         HAVING cats > 1
         ORDER  BY id),
     -- People who ordered from at least three categories
     cat_three
     AS (SELECT id,
                Count(id) AS cats
         FROM   cat_one
         GROUP  BY id
         HAVING cats > 2
         ORDER  BY id),
     -- People who ordered from at least four categories
     cat_four
     AS (SELECT id,
                Count(id) AS cats
         FROM   cat_one
         GROUP  BY id
         HAVING cats > 3
         ORDER  BY id)
-- Now we union these four results to produce a single table
-- that we'll use to build our funnel chart. The table will have two columns:
-- the Step: number of categories (our step),
-- and the count of customers (our measure).
SELECT 'Ordered from one category' AS "Step: number of categories",
       Count(*)                    AS Customers
FROM   cat_one
UNION
SELECT 'Ordered from two categories' AS "Step: number of categories",
       Count(*)                      AS Customers
FROM   cat_two
UNION
SELECT 'Ordered from three categories' AS "Step: number of categories",
       Count(*)                        AS Customers
FROM   cat_three
UNION
SELECT 'Ordered from four categories' AS "Step: number of categories",
       Count(*)                       AS Customers
FROM   cat_four
ORDER  BY customers DESC
應該產生
| Step: number of categories | CUSTOMERS |
|-------------------------------|-----------|
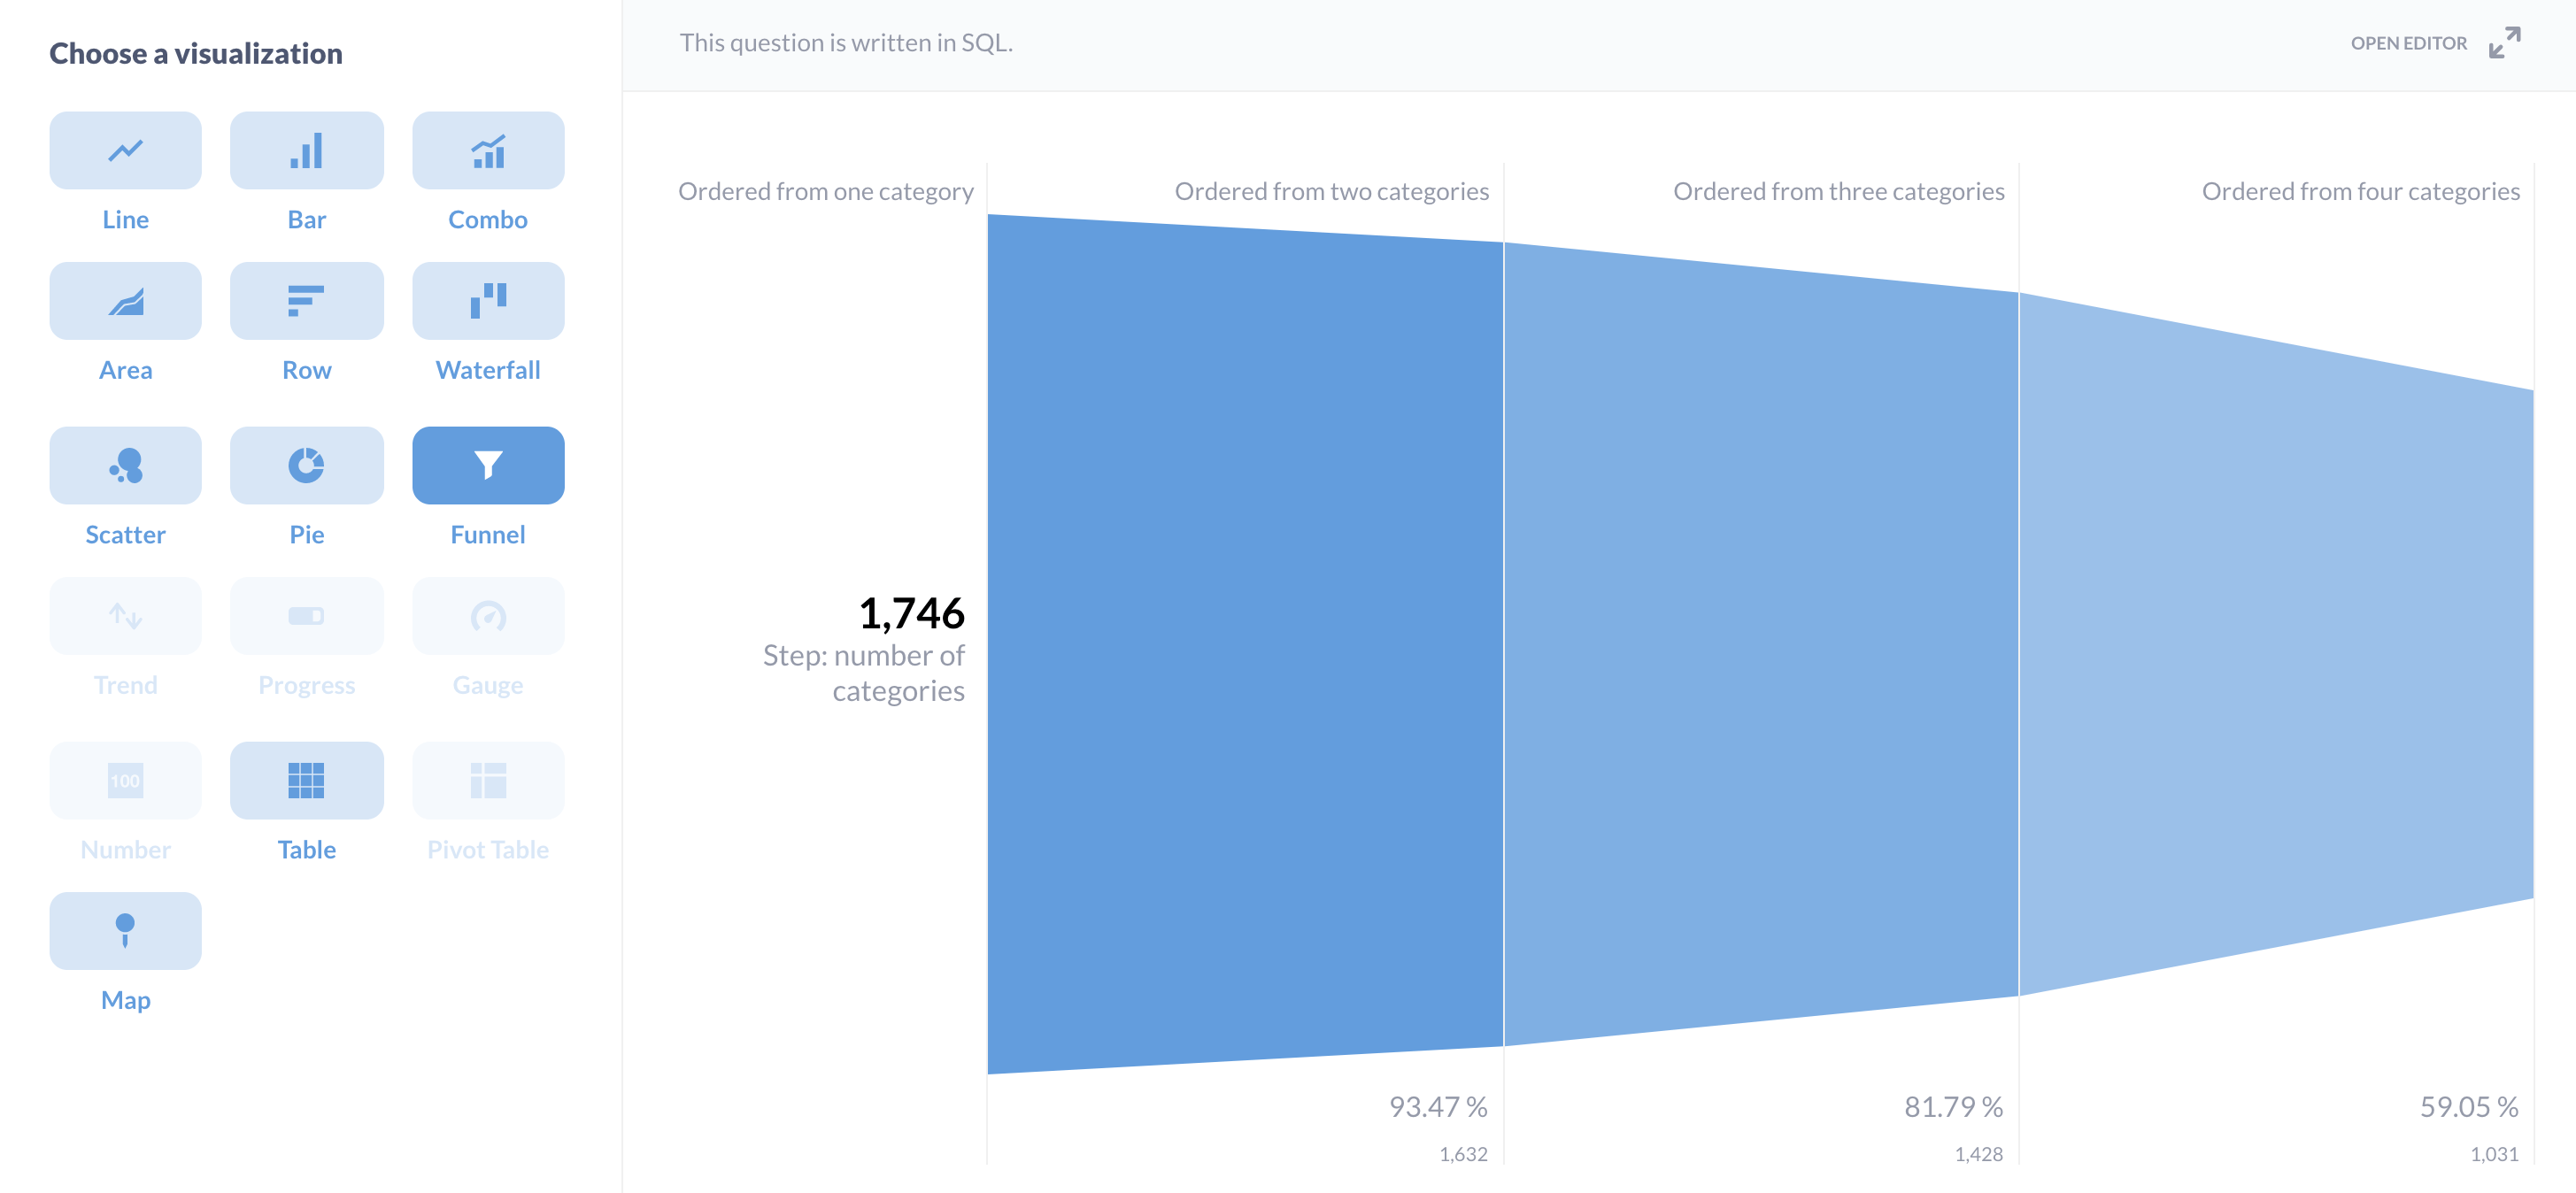
| Ordered from one category | 1,746 |
| Ordered from two categories | 1,632 |
| Ordered from three categories | 1,428 |
| Ordered from four categories | 1,031 |
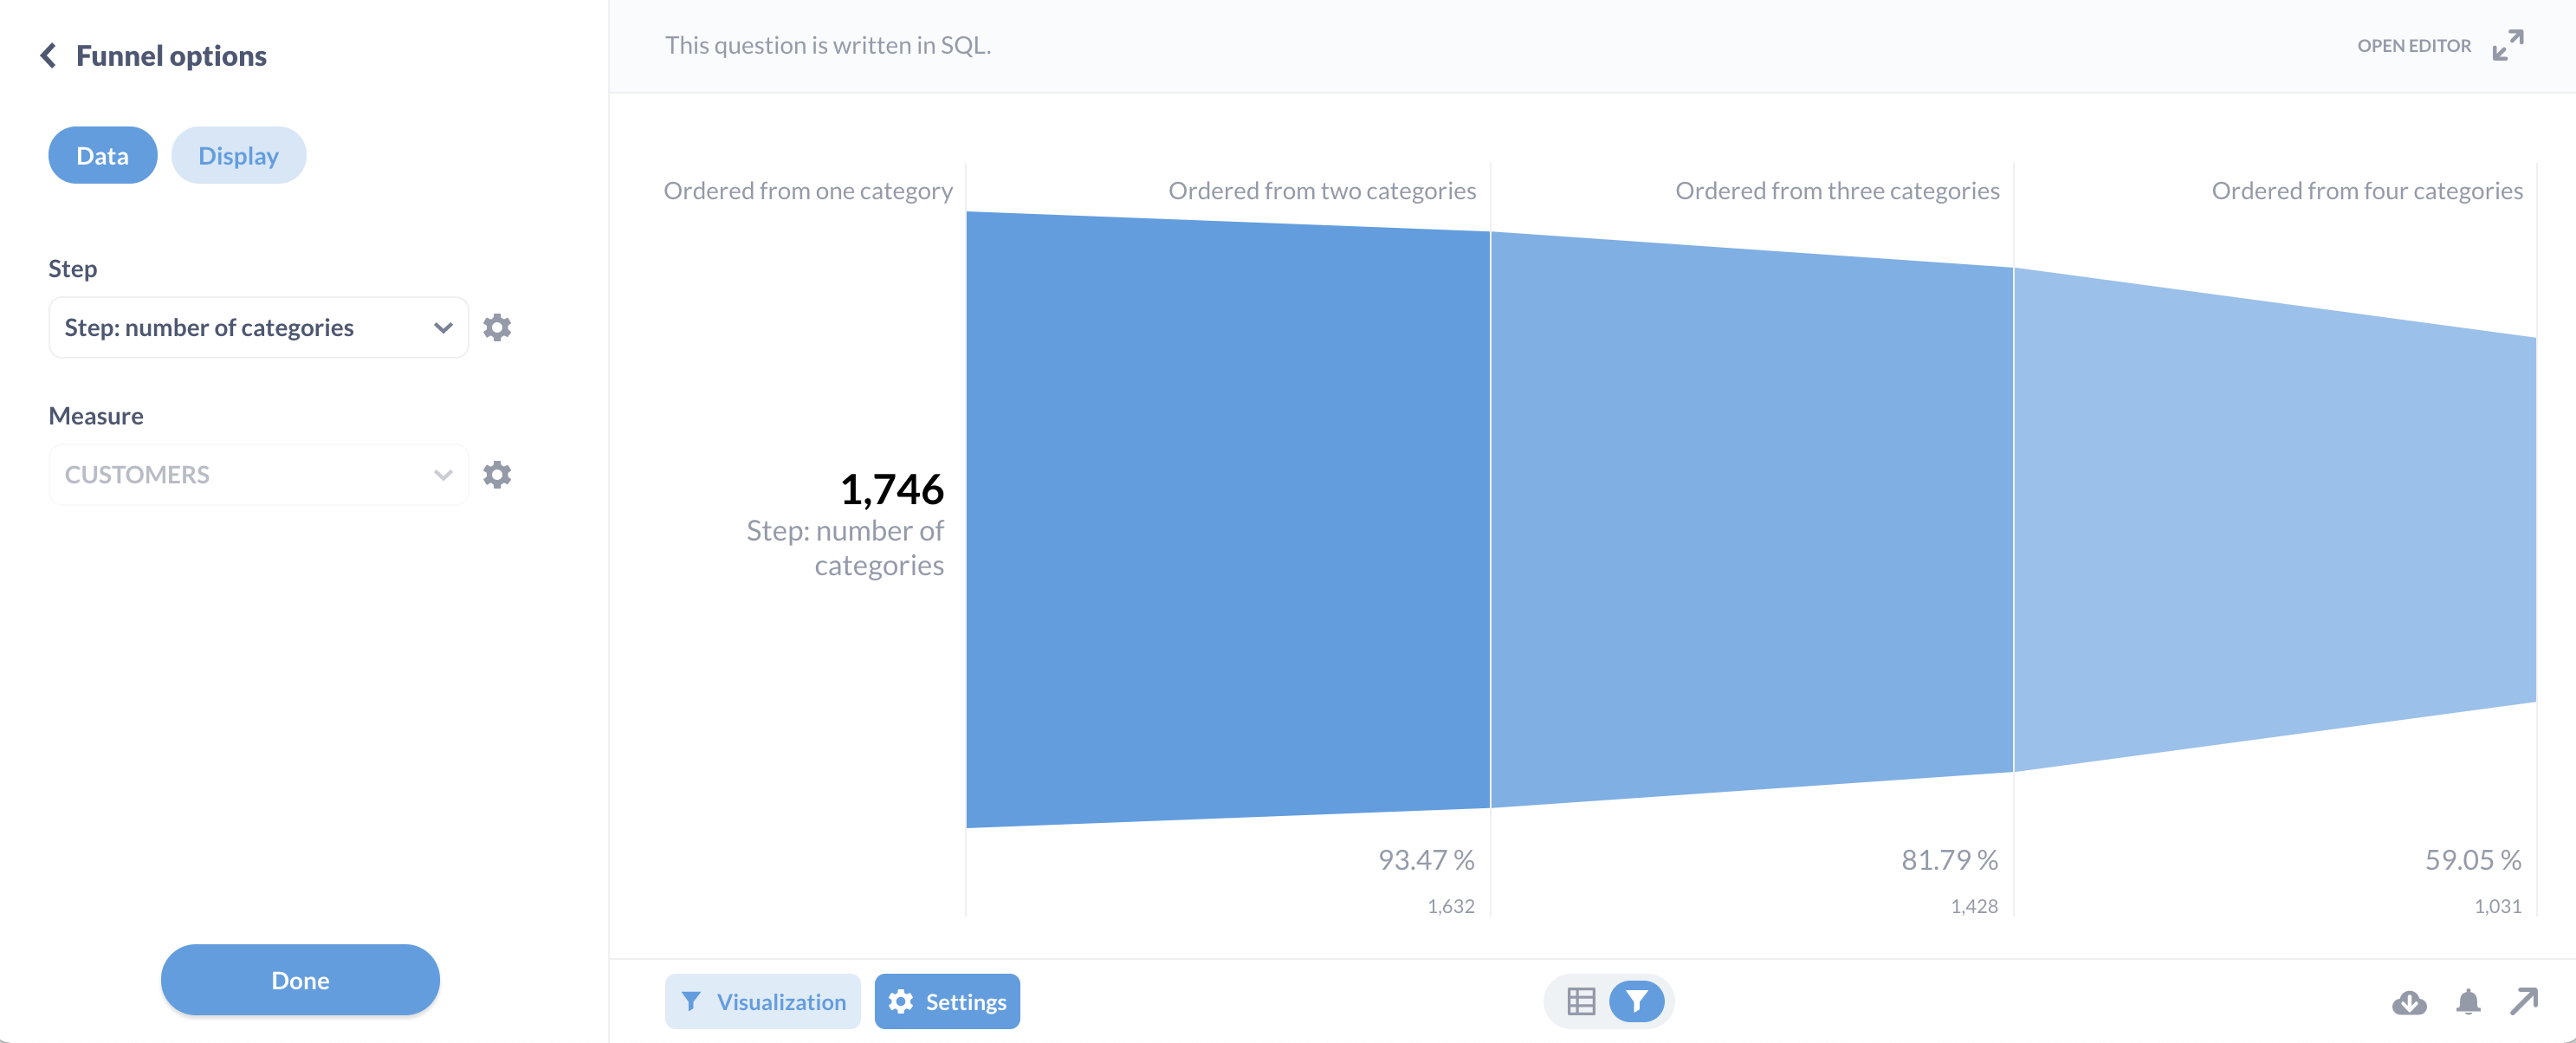
現在我們所要做的就是按一下左下角的視覺化,然後選取漏斗。
如果您開啟設定標籤,您可以變更步驟或度量。在顯示標籤中,您可以將圖表從漏斗變更為長條圖(雖然如上所述,您將失去視覺隱喻和度量相對於第一個步驟的百分比)。
在 SQL 中保持步驟排序
如同上面的查詢產生器,若要強制執行步驟順序,您可以新增一個額外的欄(我們將其稱為「步驟」
SELECT 'Ordered from one category' AS "Step: number of categories",
       Count(*)                    AS Customers,
       1 as step
FROM   cat_one
UNION
SELECT 'Ordered from two categories' AS "Step: number of categories",
       Count(*)                      AS Customers,
       2 as step
FROM   cat_two
UNION
SELECT 'Ordered from three categories' AS "Step: number of categories",
       Count(*)                        AS Customers,
       3 as step
FROM   cat_three
UNION
SELECT 'Ordered from four categories' AS "Step: number of categories",
       Count(*)                       AS Customers,
       4 as step
FROM   cat_four
ORDER  BY step