

使用 Prometheus 進行可觀察性
您可以從您的 Metabase 以 Prometheus 格式匯出指標。
在本機執行 Metabase 和 Prometheus
為了讓您瞭解 Metabase 和 Prometheus 在您的生產環境中如何運作,我們將逐步說明如何在本地設定 Metabase 和 Prometheus。
使用 MB_PROMETHEUS_SERVER_PORT 啟動 Metabase
下載最新的 Metabase JAR,並使用環境變數執行 Metabase 以指定 Prometheus 伺服器連接埠
MB_PROMETHEUS_SERVER_PORT=9191 java --add-opens java.base/java.nio=ALL-UNNAMED -jar metabase.jar
MB_PROMETHEUS_SERVER_PORT=9191 指定 Metabase 將使用哪個連接埠 (9191) 將資料傳送至 Prometheus。為了釐清這裡將涉及的連接埠
- 連接埠
3000是 Metabase 用來提供 Metabase 應用程式服務的連接埠。您可以使用MB_JETTY_PORT設定另一個連接埠 (例如,MB_JETTY_PORT=3001)。 - 連接埠
9191(或您使用MB_PROMETHEUS_SERVER_PORT環境變數指定的任何連接埠) 是 Prometheus 用來從 Metabase 抓取指標的連接埠。 - 連接埠
9090是 Prometheus 用來提供 Prometheus 應用程式服務的連接埠。
當您啟動 Metabase 時,Metabase 記錄檔會告知您 Metabase 正在啟動 prometheus metrics collector 和 prometheus metrics web-server。
(truncated logs)
2022-09-01 17:47:38,808 INFO metabase.util :: Database setup took 3.4 s
2022-09-01 17:47:38,826 INFO metabase.core :: Setting up prometheus metrics
2022-09-01 17:47:38,827 INFO metabase.prometheus :: Starting prometheus metrics collector
2022-09-01 17:47:38,839 INFO metabase.prometheus :: Starting prometheus metrics web-server on port 9,191
(truncated logs)
您可以在 https://127.0.0.1:3000 查看您在本機執行的 Metabase。
下載並設定 Prometheus
下載 Prometheus,並解壓縮檔案。
變更至 Prometheus 目錄,新增下列 YAML 檔案以設定您的 Prometheus
Prometheus 組態檔範例
global:
  scrape_interval: 15s # By default, scrape targets every 15 seconds.

  # Attach these labels to any time series or alerts when communicating with
  # external systems (federation, remote storage, Alertmanager).
  external_labels:
    monitor: "codelab-monitor"

# A scrape configuration containing exactly one endpoint to scrape:
# Here it's Prometheus itself.
scrape_configs:
  # The job name is added as a label `job=<job_name>` to any timeseries scraped from this config.
  - job_name: "prometheus"

    # Override the global default and scrape targets from this job every 5 seconds.
    scrape_interval: 5s
    # use whatever port here that you set for MB_PROMETHEUS_SERVER_PORT
    static_configs:
      - targets: ["localhost:9191"]
您需要將「target」變更為 Metabase 所在的位置,對於此特定範例,Metabase 與 Prometheus 執行所在的主機 (「localhost」) 位於同一位置。
在本機執行 Prometheus
在 Prometheus 目錄中的新終端機處理程序中,執行
./prometheus --config.file=prometheus.yml
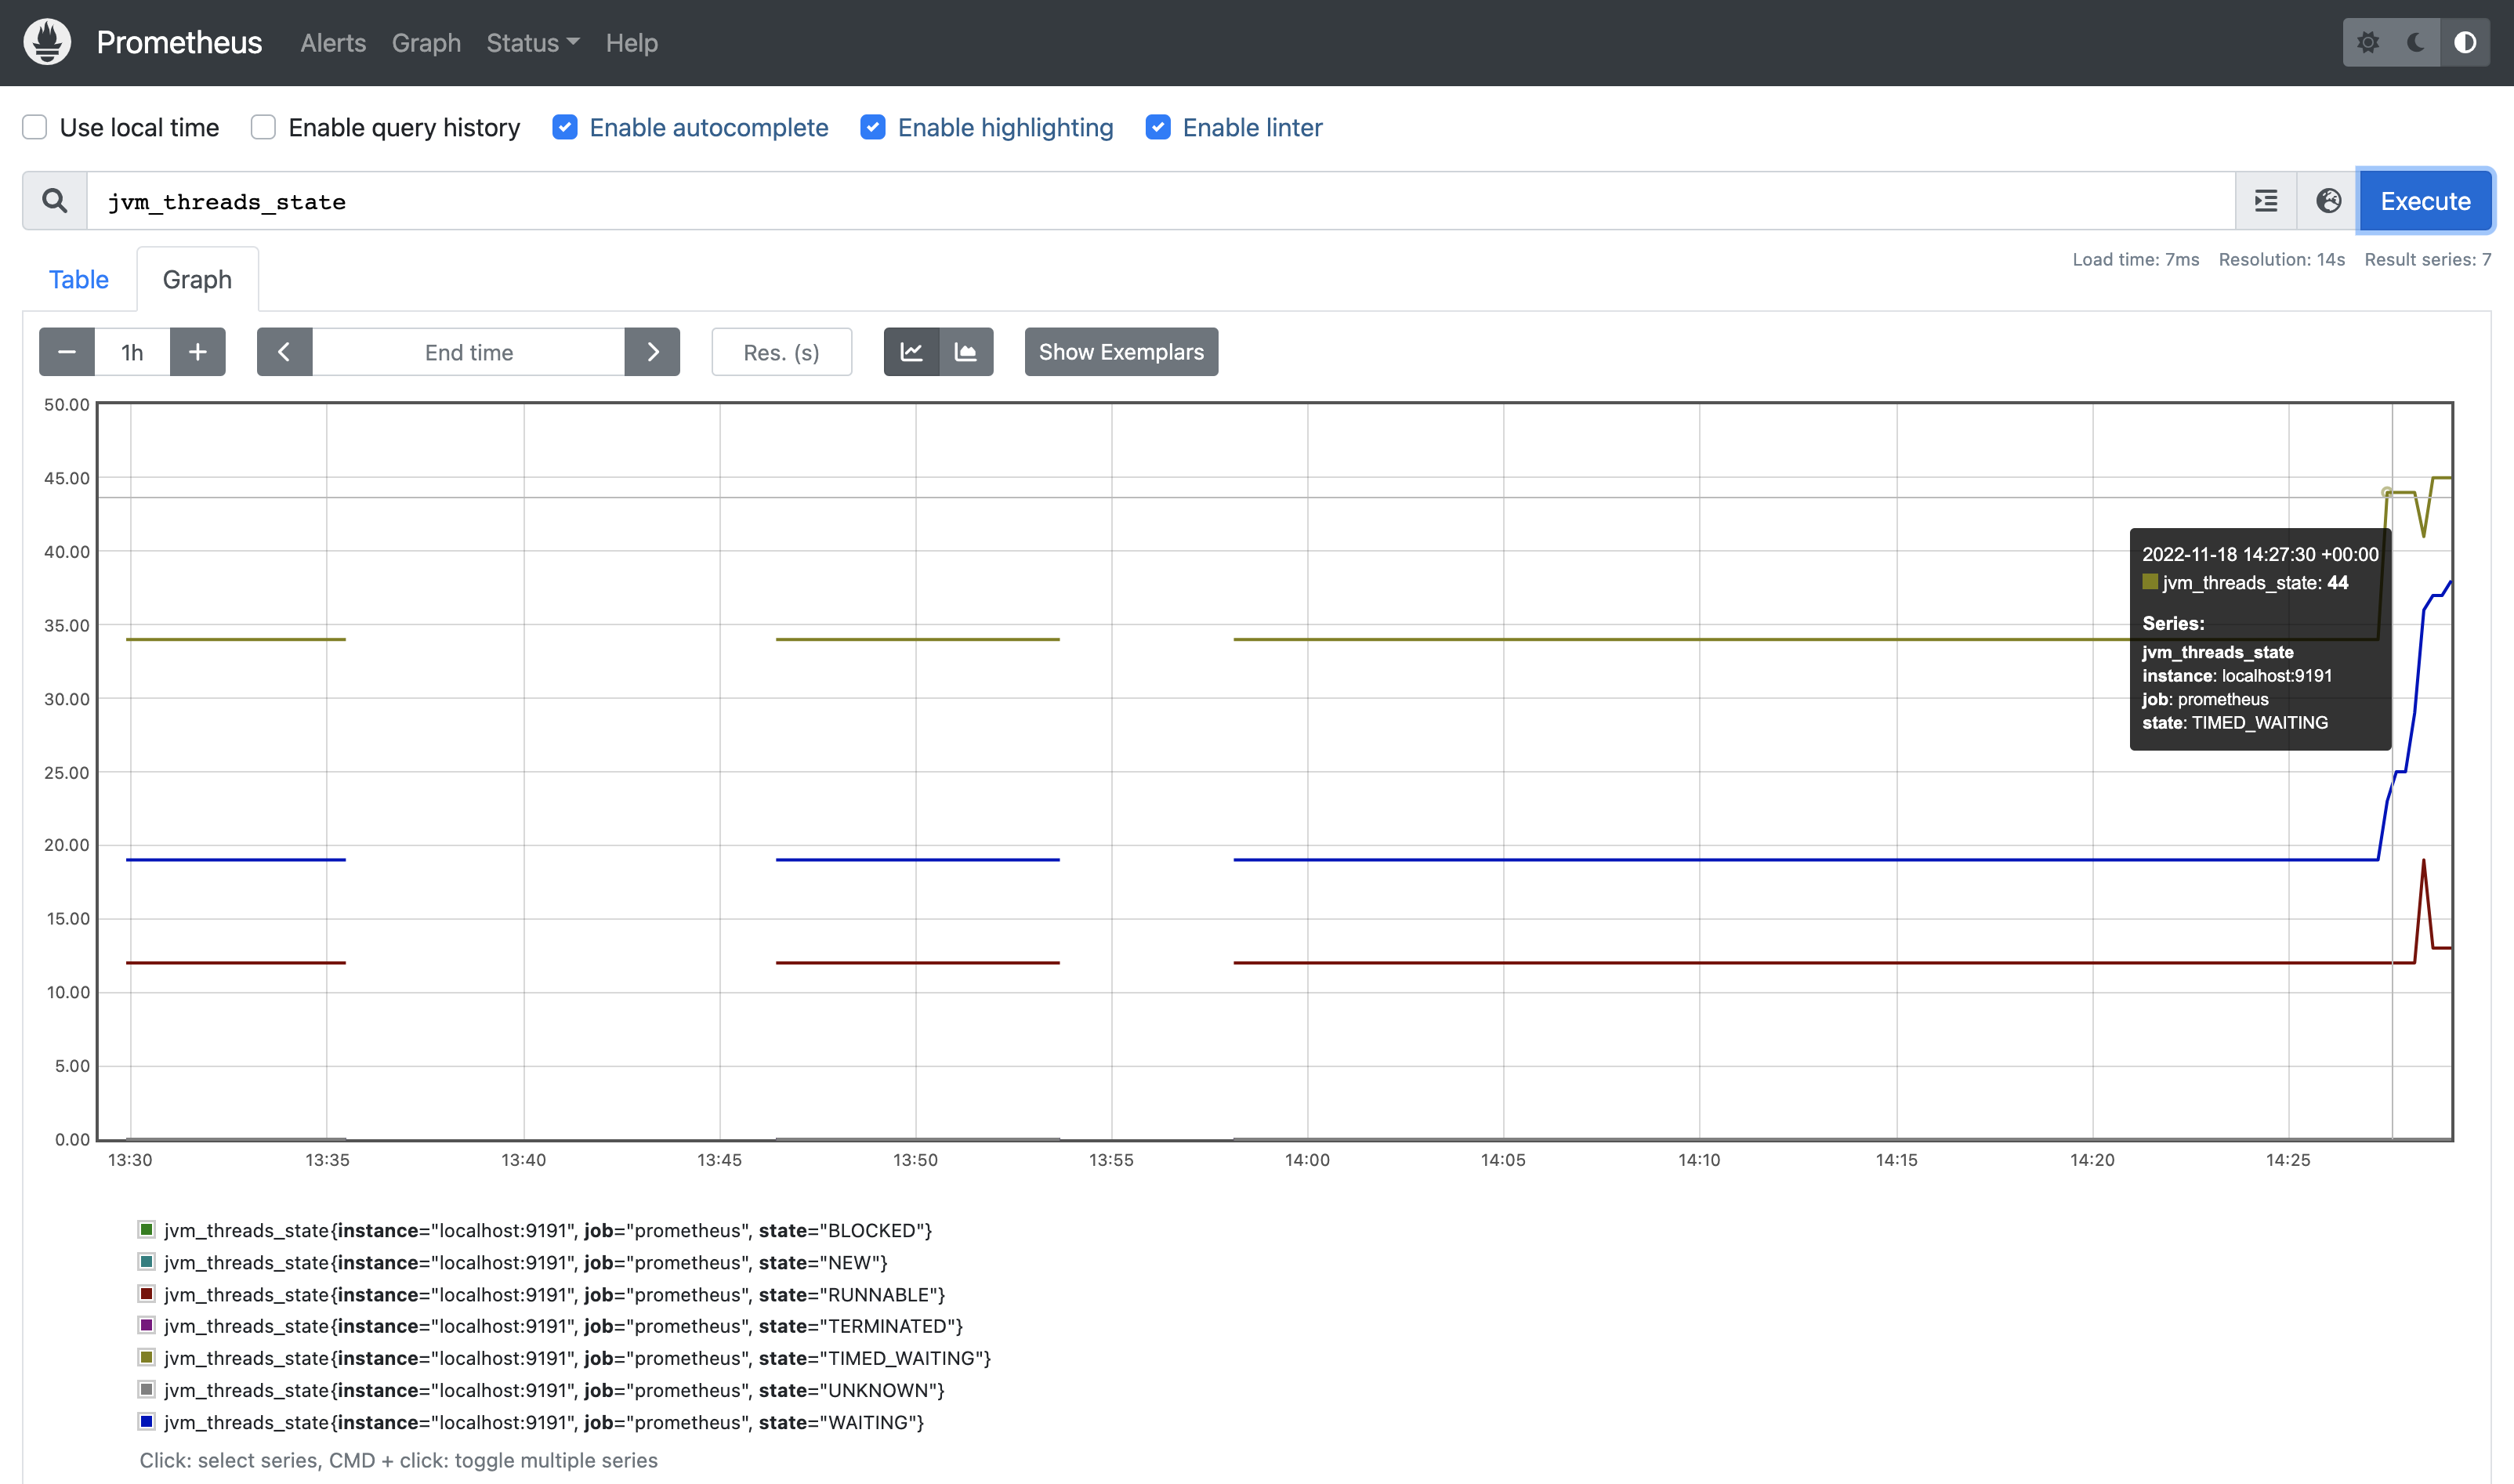
然後檢查 https://127.0.0.1:9090。您應該會看到 Prometheus 應用程式,並且能夠搜尋 Metabase 發出的各種指標。
範例指標輸出
以下是一些來自 Metabase 的範例輸出
'# HELP jvm_threads_current Current thread count of a JVM
'# TYPE jvm_threads_current gauge
jvm_threads_current 81.0
'# HELP jvm_threads_daemon Daemon thread count of a JVM
'# TYPE jvm_threads_daemon gauge
jvm_threads_daemon 36.0
'# HELP jvm_threads_peak Peak thread count of a JVM
'# TYPE jvm_threads_peak gauge
jvm_threads_peak 81.0
'# HELP jvm_threads_started_total Started thread count of a JVM
'# TYPE jvm_threads_started_total counter
jvm_threads_started_total 104.0
'# HELP jvm_threads_deadlocked Cycles of JVM-threads that are in deadlock waiting to acquire object monitors or ownable synchronizers
'# TYPE jvm_threads_deadlocked gauge
jvm_threads_deadlocked 0.0
已匯出的指標
Metabase 匯出的指標包括
c3p0_max_pool_sizec3p0_min_pool_sizec3p0_num_busy_connectionsc3p0_num_connectionsc3p0_num_idle_connectionsc3p0_num_threads_awaiting_checkout_default_userjetty_async_dispatches_totaljetty_async_requests_totaljetty_async_requests_waitingjetty_async_requests_waiting_maxjetty_dispatched_activejetty_dispatched_active_maxjetty_dispatched_time_maxjetty_dispatched_time_seconds_totaljetty_dispatched_totaljetty_expires_totaljetty_request_time_max_secondsjetty_request_time_seconds_totaljetty_requests_activejetty_requests_active_maxjetty_requests_totaljetty_responses_bytes_totaljetty_responses_totaljetty_stats_secondsjvm_gc_collection_seconds_countjvm_gc_collection_seconds_sumjvm_memory_bytes_committedjvm_memory_bytes_initjvm_memory_bytes_maxjvm_memory_bytes_usedjvm_memory_objects_pending_finalizationjvm_memory_pool_bytes_committedjvm_memory_pool_bytes_initjvm_memory_pool_bytes_maxjvm_memory_pool_bytes_usedjvm_memory_pool_collection_committed_bytesjvm_memory_pool_collection_init_bytesjvm_memory_pool_collection_max_bytesjvm_memory_pool_collection_used_bytesjvm_threads_currentjvm_threads_daemonjvm_threads_deadlockedjvm_threads_deadlocked_monitorjvm_threads_peakjvm_threads_started_totaljvm_threads_stateprocess_cpu_seconds_totalprocess_max_fdsprocess_open_fdsprocess_start_time_secondsprocess_virtual_memory_bytesmetabase_email_messages_totalmetabase_email_messages_createdmetabase_email_message_errors_totalmetabase_email_message_errors_created
延伸閱讀
閱讀其他版本的 Metabase 文件。